Digital Humanities 2013 is on its way; submissions are closed, peers will be reviewing them shortly, and (most importantly for this post) the people behind the conference are experimenting with a new method of matching submissions to reviewers. It’s a bidding process; reviewers take a look at the many submissions and state their reviewing preferences or, when necessary, conflicts of interest. It’s unclear the extent to which these preferences will be accommodated, as this is an experiment on their part. Bethany Nowviskie describes it here. As a potential reviewer, I just went through the process of listing my preferences, and managed to do some data scraping while I was there. How could I not? All 348 submission titles were available to me, as well as their authors, topic selections, and keywords, and given that my submission for this year is all about quantitatively analyzing DH, it was an opportunity I could not pass up. Given that these data are sensitive, and those who submitted did so under the assumption that rejected submissions would remain private, I’m opting not to release the data or any non-aggregated information. I’m also doing my best not to actually read the data in the interest of the privacy of my peers; I suppose you’ll all just have to trust me on that one, though.
So what are people submitting? According to the topics authors assigned to their 348 submissions, 65 submitted articles related to “literary studies,” trailed closely by 64 submissions which pertained to “data mining/ text mining.” Work on archives and visualizations are also up near the top, and only about half as many authors submitted historical studies (37) as those who submitted literary ones (65). This confirms my long suspicion that our current wave of DH (that is, what’s trending and exciting) focuses quite a bit more on literature than history. This makes me sad. You can see the breakdown in Figure 1 below, and further analysis can be found after.

Figure 1: Number of documents with each topic authors assigned to submissions for DH2013 (click to enlarge).
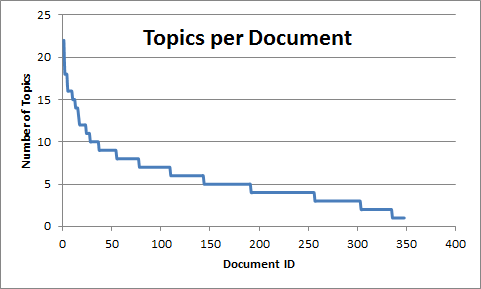
The majority of authors attached fewer than five topics to their submissions; a small handful included over 15. Figure 2 shows the number of topics assigned to each document.
I was curious how strongly each topic coupled with other topics, and how topics tended to cluster together in general, so I extracted a topic co-occurrence network. That is, whenever two topics appear on the same document, they are connected by an edge (see Networks Demystified Pt. 1 for a brief introduction to this sort of network); the more times two topics co-occur, the stronger the weight of the edge between them.
Topping off the list at 34 co-occurrences were “Data Mining/ Text Mining” and “Text Analysis,” not terrifically surprising as the the latter generally requires the former, followed by “Data Mining/ Text Mining” and “Content Analysis” at 23 co-occurrences, “Literary Studies” and “Text Analysis” at 22 co-occurrences, “Content Analysis” and “Text Analysis” at 20 co-occurrences, and “Data Mining/ Text Mining” and “Literary Studies” at 19 co-occurrences. Basically what I’m saying here is that Literary Studies, Mining, and Analysis seem to go hand-in-hand.
Knowing my readers, about half of you are already angry with me counting co-occurrences, and rightly so. That measurement is heavily biased by the sheer total number of times a topic is used; if “literary studies” is attached to 65 submissions, it’s much more likely that it will co-occur with any particular topic than topics (like “teaching and pedagogy”) which simply appear more infrequently. The highest frequency topics will co-occur with one another simply by an accident of magnitude.
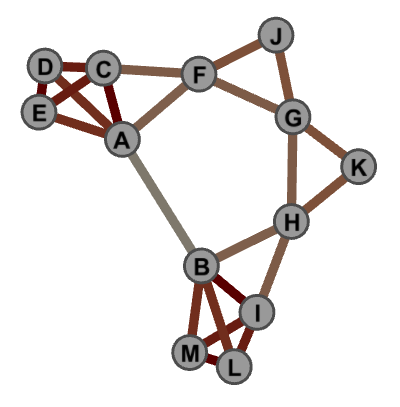
To account for this, I measured the neighborhood overlap of each node on the topic network. This involves first finding the number of other topics a pair of two topics shares. For example, “teaching and pedagogy” and “digital humanities – pedagogy and curriculum” each co-occur with several other of the same topics, including “programming,” “interdisciplinary collaboration,” and “project design, organization, management.” I summed up the number topical co-occurrences between each pair of topics, and then divided that total by the number of co-occurrences each node in the pair had individually. In short, I looked at which pairs of topics tended to share similar other topics, making sure to take into account that some topics which are used very frequently might need some normalization. There are better normalization algorithms out there, but I opt to use this one for its simplicity for pedagogical reasons. The method does a great job leveling the playing field between pairs of infrequently-used topics compared to pairs of frequently-used topics, but doesn’t fair so well when looking at a pair where one topic is popular and the other is not. The algorithm is well-described in Figure 3, where the darker the edge, the higher the neighborhood overlap.

Figure 3: The neighborhood overlap between two nodes is how many neighbors (or connections) that pair of nodes shares. As such, A and B share very few connections, so their overlap is low, whereas D and E have quite a high overlap. Via Jaroslav Kuchar.
Neighborhood overlap paints a slightly different picture of the network. The pair of topics with the largest overlap was “Internet / World Wide Web” and “Visualization,” with 90% of their neighbors overlapping. Unsurprisingly, the next-strongest pair was “Teaching and Pedagogy” and “Digital Humanities – Pedagogy and Curriculum.” The data might be used to suggest multiple topics that might be merged into one, and this pair seems to be a pretty good candidate. “Visualization” also closely overlaps “Data Mining/ Text Mining”, which itself (as we saw before) overlaps with “Cultural Studies” and “Literary Studies.” What we see from this close clustering both in overlap and in connection strength is the traces of a fairly coherent subfield out of DH, that of quantitative literary studies. We see a similarly tight-knit cluster between topics concerning archives, databases, analysis, the web, visualizations, and interface design, which suggests another genre in the DH community: the (relatively) recent boom of user interfaces as workbenches for humanists exploring their archives. Figure 4 represents the pairs of topics which overlap to the highest degree; topics without high degrees of pair correspondence don’t appear on the network graph.

Figure 4: Network of topical neighborhood overlap. Edges between topics are weighted according to how structurally similar the two topics are. Topics that are structurally isolated are not represented in this network visualization.
The topics authors chose for each submission were from a controlled vocabulary. Authors also had the opportunity to attach their own keywords to submissions, which unsurprisingly yielded a much more diverse (and often redundant) network of co-occurrences. The resulting network revealed a few surprises: for example, “topic modeling” appears to be much more closely coupled with “visualization” than with “text analysis” or “text mining.” Of course some pairs are not terribly surprising, as with the close connection between “Interdisciplinary” and “Collaboration.” The graph also shows that the organizers have done a pretty good job putting the curated topic list together, as a significant chunk of the high thresholding keywords are also available in the topic list, with a few notable exceptions. “Scholarly Communication,” for example, is a frequently used keyword but not available as a topic – perhaps next year, this sort of analysis can be used to help augment the curated topic list. The keyword network appears in Figure 5. I’ve opted not to include a truly high resolution image to dissuade readers from trying to infer individual documents from the keyword associations.

Figure 5: Which keywords are used together on documents submitted to DH2013? Nodes are colored by cluster, and edges are weighted by number of co-occurrences. Click to enlarge.
There’s quite a bit of rich data here to be explored, and anyone who does have access to the bidding can easily see that the entire point of my group’s submission is exploring the landscape of DH, so there’s definitely more to come on the subject from this blog. I especially look forward to seeing what decisions wind up being made in the peer review process, and whether or how that skews the scholarly landscape at the conference.
On a more reflexive note, looking at the data makes it pretty clear that DH isn’t as fractured as some occasionally suggest (New Media vs. Archives vs. Analysis, etc.). Every document is related to a few others, and they are all of them together connected in a rich family, a network, of Digital Humanities. There are no islands or isolates. While there might be no “The” Digital Humanities, no unifying factor connecting all research, there are Wittgensteinian family resemblances connecting all of these submissions together, in a cohesive enough whole to suggest that yes, we can reasonably continue to call our confederation a single community. Certainly, there are many sub-communities, but there still exists an internal cohesiveness that allows us to differentiate ourselves from, say, geology or philosophy of mind, which themselves have their own internal cohesiveness.
